| |
POSTMORTEM OF SE ARIZONA WEATHER:
Saturday 15 JULY 2006
OVERVIEW
The weather events of this past Saturday really beg for a fairly detailed
postmortem analysis. The e-mail buzz on Saturday morning was about how big
a storm day it would be in southeast Arizona; the local forecast had 40% POPs (as high as they've gone this summer I think); there was a severe
thunderstorm watch issued for much of the southern third of the state (the
4th watch this year I think).
Storms developed over the higher Rim country north of Phoenix during
mid-afternoon and also to the east of Phoenix over higher terrain. These
storms moved rapidly to the west-southwest, eventually forming a fairly
large MCS (for Arizona). The principal weather produced was lightning,
wind, and dust storms. The MCS eventually moved across extreme southern
California and northern Baja and on westward over the Pacific (as noted by
Lance Bosart's mapper post). The MCS left behind a mid-level MCV that
looked like a mini-tropical storm at midday on the 16th.
NOTE: click on each figure for a larger view
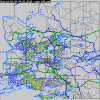
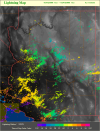
Figure 1
Figure 2
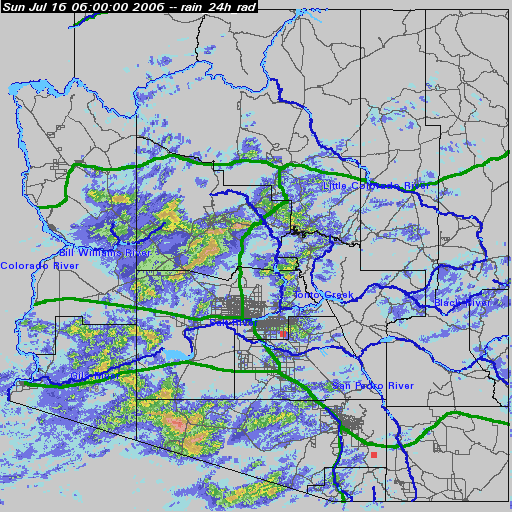
Figure 1 presents radar-estimated rainfall for
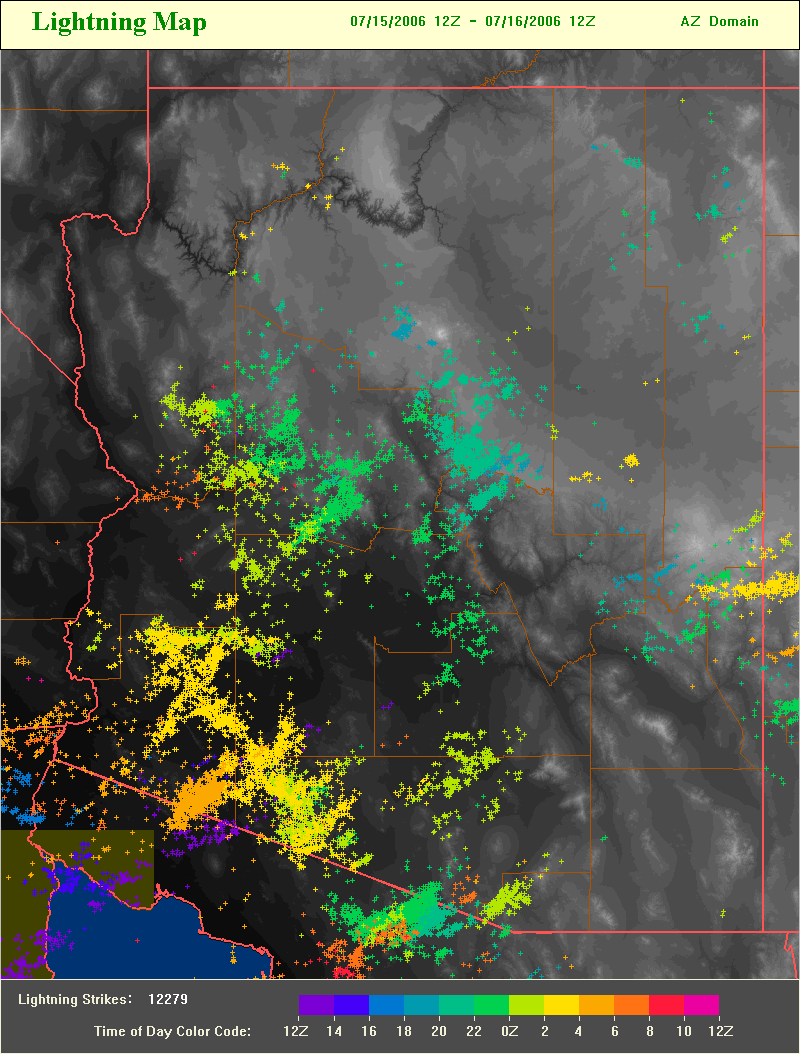
Arizona ending at 1200 UTC on the 16th, while Fig. 2 shows the
cloud-to-ground lightning strike locations for the same period. The
radar-rainfall shows that there weren't widespread areas of significant
rainfall with the storms. Regions that experienced the heaviest storms
were very remote. The figure also seems to indicate that the storm
clusters from the mountains weakened, before re-developing and re-grouping into
the dominant MCS over southwestern Arizona. The CG plot indicates this
also, with a dearth of CGs over the Phoenix region (dare I call
it the infamous circle of tstm death?) of suppression This region is somewhat
circular and is of low elevation. The 0423 UTC IR satellite image (Fig.
3) shows that the Arizona MCS had raced to the southwest corner of the
state by that time. The MCS in Sonora is much larger and more interesting, as is
usually the case.
Figure 3
Rainfall reports from the Arizona daily station list show
also that there was not much rain measured with the storms. Of 57 stations
reporting 24-h precipitation amounts at 5 am on the 16th of July, only 14
had 0.01" or more, of these 7 stations had 0.10" or more, 3 of these had
0.25" or more, and 1 had 0.50" or more (Payson reported 0.62").
The intense storms occurred mostly over southwest Arizona, while the
southeast portion of state was very suppressed. There were 4 severe storm
reports that were in or near the western half of watch area but the the
eastern third of the watch was devoid of thunderstorms even. Even though
significant thunderstorm activity was expected over the southeastern
portion of Arizona, this part of the state was very suppressed.
WHAT HAPPENED?
So how did an apparently "good" situation go so badly awry?
Figure 4
Let's focus on the upper-air soundings in this postmortem.
Figure 4 is the skew-T plot of the Tucson morning sounding. The
sounding shows a moist layer from about 600 mb to 300 mb (positive); wind
directions at anvil level are backed 40 degrees or so relative to the
"steering" winds in the 600 to 400 mb layer (good); well mixed boundary
layer CAPE is indicated, although the amount of CAPE is not great
(especially wrt severe storm soundings from the Plains), it is
typical of amounts that often produce nice storms and downbursts out here;
the standard-level charts (not shown) depicted an unusually strong
upper-level cyclone centered in northern Mexico, south of the Texas Big
Bend. This synoptic-scale system was moving west-northwestward toward
southeast Arizona and this type scenario is often favorable for increased
thunderstorm activity.
The primary bugaboo on Saturday seems to have been that the approaching
synoptic-scale system was strong enough to "override" the usual diurnal
boundary layer flow regime, bringing pronounced downslope, drying,
boundary layer winds to southeastern Arizona. Note that terrain elevations
decrease from 5-6,000 ft msl along the Continental Divide in southwestern
New Mexico to about 2,500 ft msl in the Tucson area. If one examines
Fig.
4 carefully, it shows that strong east winds were already present in
the boundary layer at Tucson. Data from El Paso (not shown) also detected
this situation. By afternoon on the 15th in Tucson east to southeast winds
at the surface (the typical afternoon surface wind is from the west to
northwest) were blowing at 10 to 15 kts, and the surface dewpoint had
plummeted from 64F at 9am to only 42F at 5 pm. Interestingly, the morning
sounding at Phoenix (Fig. 5) showed quite different low-level
flow over central Arizona, where there would be strong storm activity
later in the day. The 00 UTC sounding at Tucson (Fig. 6)
indicates that the easterly, downslope flow had dried out the lower levels
so that the evening sounding had virtually no CAPE, again explaining the
dearth of thunderstorm development over all of southeaster Arizona.

Figure 5
Figure 6
The break-through of easterly winds to the surface
produces a curious, large mesoscale feature. The leading edge of the
easterlies becomes somewhat analogous to a "mirror-image" of the dry line
of the southern Plains. The most intense storms of both Saturday and
Sunday developed on the moist (west) side of this dryline - shown most
clearly in detailed, high-resolution WRF model forecasts (unfortunately I
was too slow on the draw to capture examples).
CONCLUSIONS
The main conclusion that I make from this brief postmortem is that this
non-event illustrates very nicely how terribly difficult summer
forecasting in the Southwest can be. It is often extremely difficult for a
forecaster to be able to anticipate accurately the thunderstorm threat for
"this afternoon and evening!"
I have forecast for many locations over the past 40 years, and I can
honestly say that I have not ever dealt with a more difficult region than
the Southwest in summer!
The presence of a "synoptically evident" feature often muddies the
evolution of a given day's weather - as per this event, when
meteorological features were presumed to be providing a setting favorable
for large scale upward motion, but in effect produced low-level flow that
destroyed what CAPE that had been present before the onset of the downslope winds.
All of this leads me to ask why the NWS spends so much effort producing
forecasts and forecast grids out through seven days, when it remains
extremely difficult, at least in this part of the country, to forecast
this evening's weather accurately? The challenges of the summer forecast
in this part of the country also explain why the forecasts rarely deviate
far from seasonal climatology - except when there is an obvious dry
period.
|