|
Figures for Comments on the
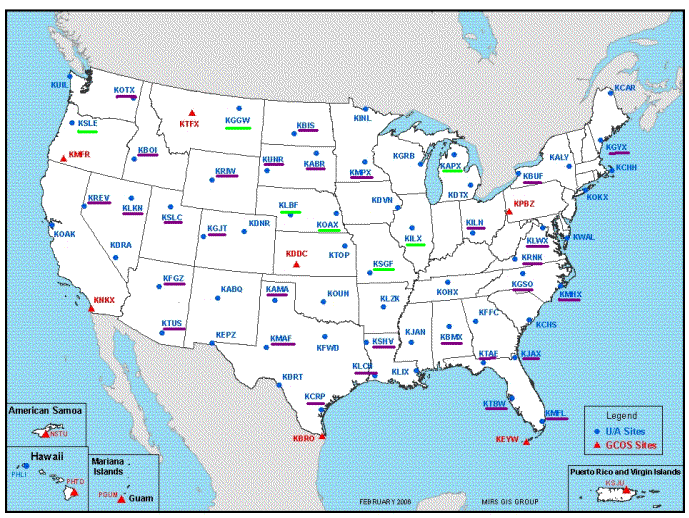
NWS Radiosonde Replacement System (RRS) Figure 1 - Map showing the NWS upper-air stations in the conterminous U.S. Purple underlining identifies the sites currently using the new RRS sondes. Green underlining indicates sites to be converted between now and September. The new sondes were first used at KLWX (8-1-05) and KSLC (9-20-05). The most recent conversions were at KMFL (5-7-07) and KTUS (6-4-07).
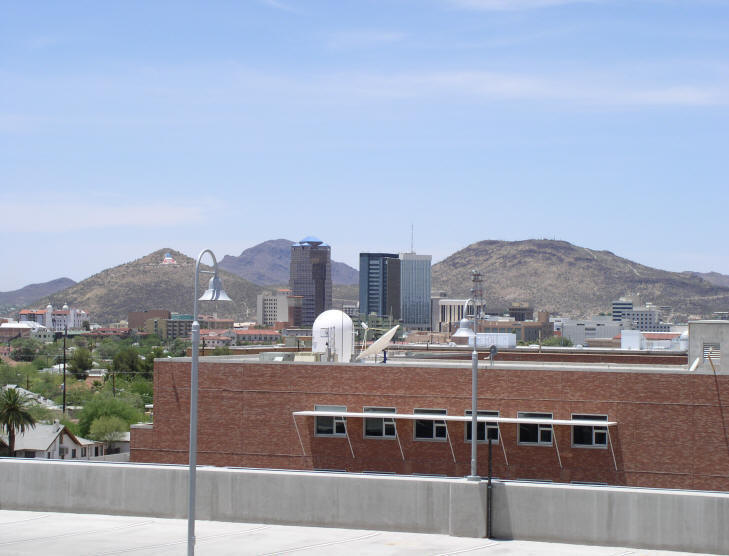
Figure 2 - Photo of the RSS white tracking dome on the roof of the NWS/USGS building. The view is to the west-southwest toward the city center from the roof of a five storey U of A parking garage to the east of the NWS/USGS building.
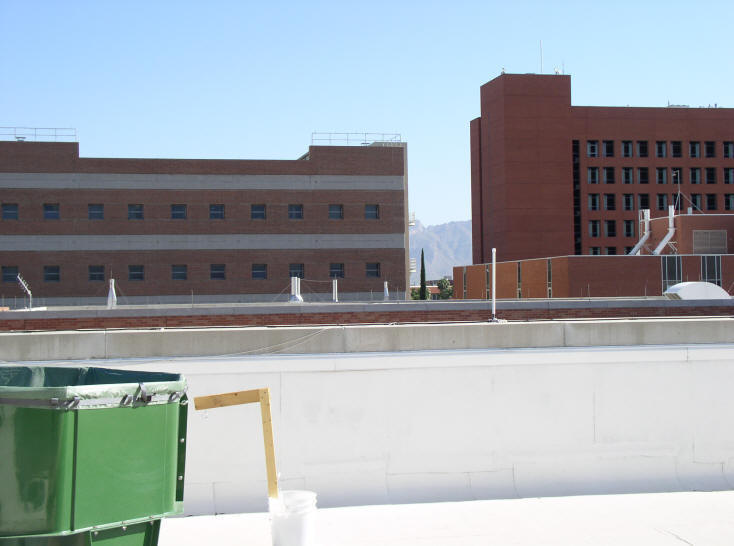
Figure 3 - Photo of two large U of A buildings located just to the north of the NWS/USGS building. See text for explanations of the green tub and wooden "gizmo" in the bucket.
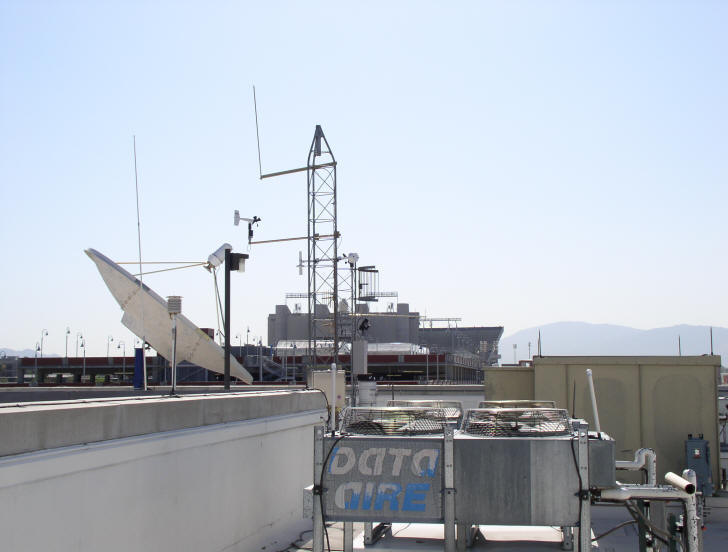
Figure 4 - Photo of the new surface observing system installed on the roof os the NWS/USGS building looking east toward the U of A football stadium.
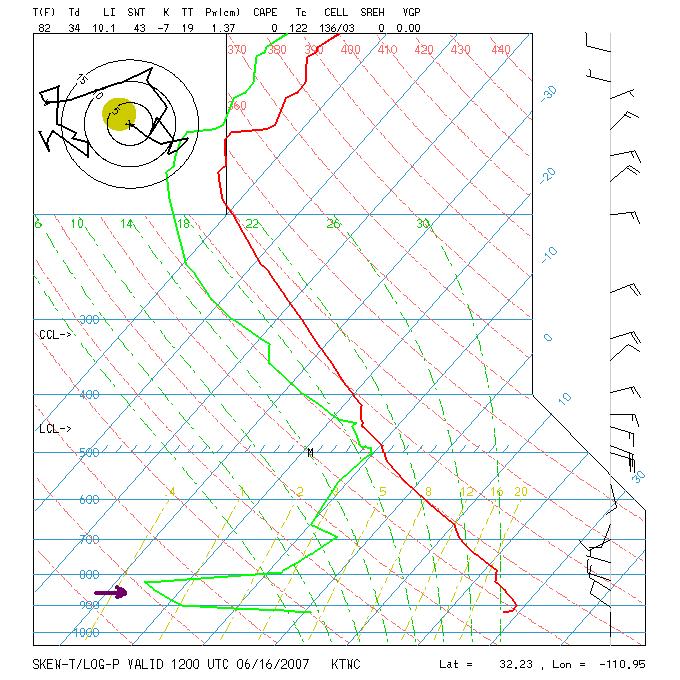
Figure 5 - Skew-T plot of TUS sounding for 1200 UTC June 16, 2007. Note that the very dry layer indicated by the purple arrow is due to hygrister problems of the Sippican sonde (sounding from UCAR RAP upper-air page).
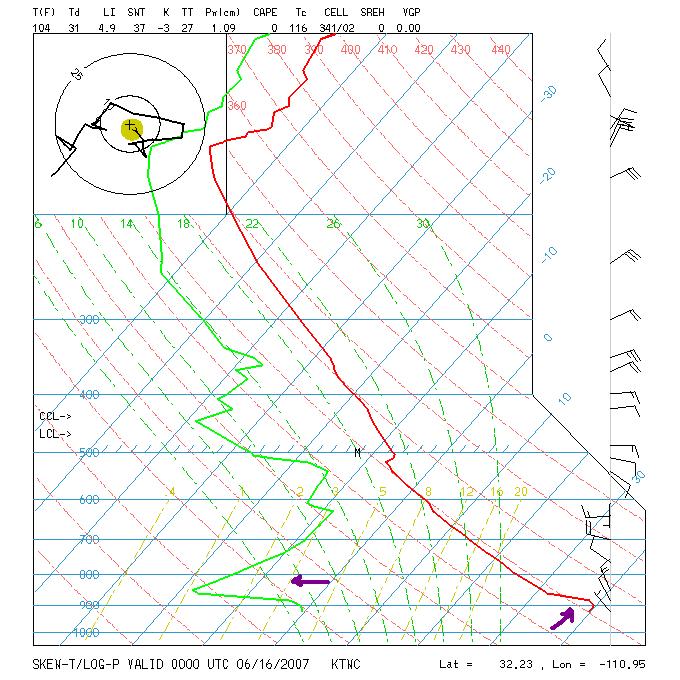
Figure 6 - Skew-T plot of TUS sounding for 0000 UTC June 16, 2007. A very dry layer is present again above the surface. The temperature structure on the roof top, and just above, seems very strange (sounding from UCAR RAP upper-air page).
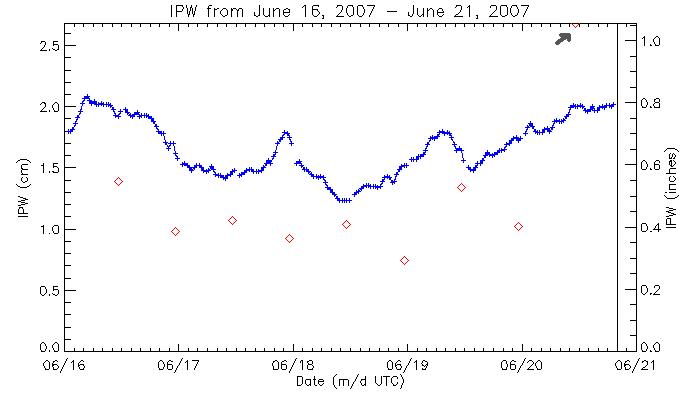
Figure 7 - Time series of integrated precipitable water (IPW) from GPS data (blue) for TUS from June 16 through June 21, 2007. The RRS sonde flights' IPW (red diamonds) for the same period are shown. For this period the RRS sonde data are consistently dry relative to the GPS IPW (both morning and evening flights) except that the morning flight on the 20th was strangely too moist (arrow indicates that diamond, which is almost off the figure - figure from NOAA FSL).
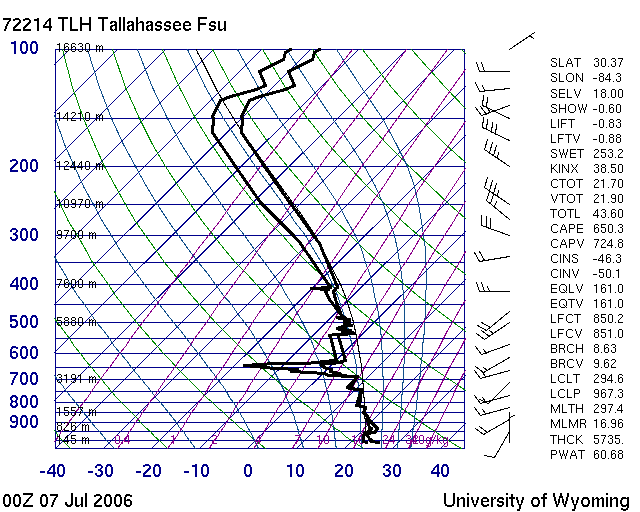
Figure 8 - An RSS sounding from Tallahassee, FL taken at 0000 UTC on July 7, 2006. There are many physically unrealistic layers present from the surface to 400 mb (sounding from the University of Wyoming upper-air web site).
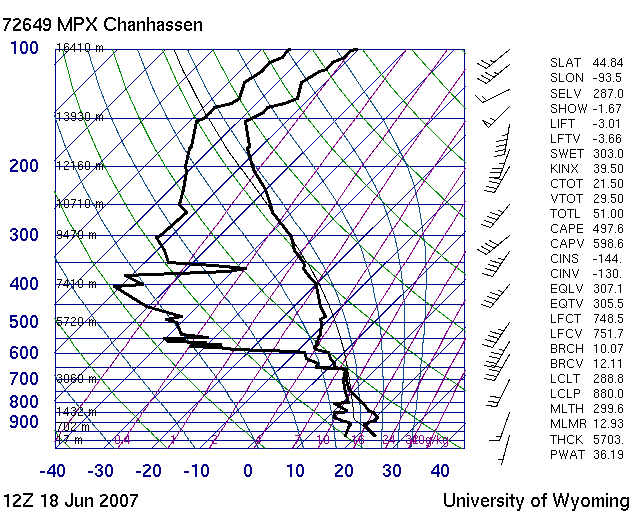
Figure 9 - An RSS sounding from Chanhassen, MN taken at 1200 UTC on June 18, 2007. The data appear physically unrealistic from 700 to 500 mb (sounding from the University of Wyoming upper-air web site).
|