Strongly Superadiabatic Lapse Rates Aloft
at Six Upper-Air Sounding Sites

Bob Maddox and Barry Schwartz
Tucson
, Arizona and Boulder, Colorado
Private Consultants

25 October 2008
 pdf file

BACKGROUND

One aspect of soundings from the new National Weather Service (NWS) Radiosonde Replacement System (RRS – details may be found at www.ua.nws.noaa.gov/RRS.htm and also on posts here during summer 2007) is that, since the thermistor is easily wetted in moist environments, strongly superadiabatic layers aloft (hereafter SSLAs) now appear frequently in the data. This is usually, but not always, due to “wetbulbing” – i.e., the rapid cooling that occurs when water/ice evaporate/sublimate from 
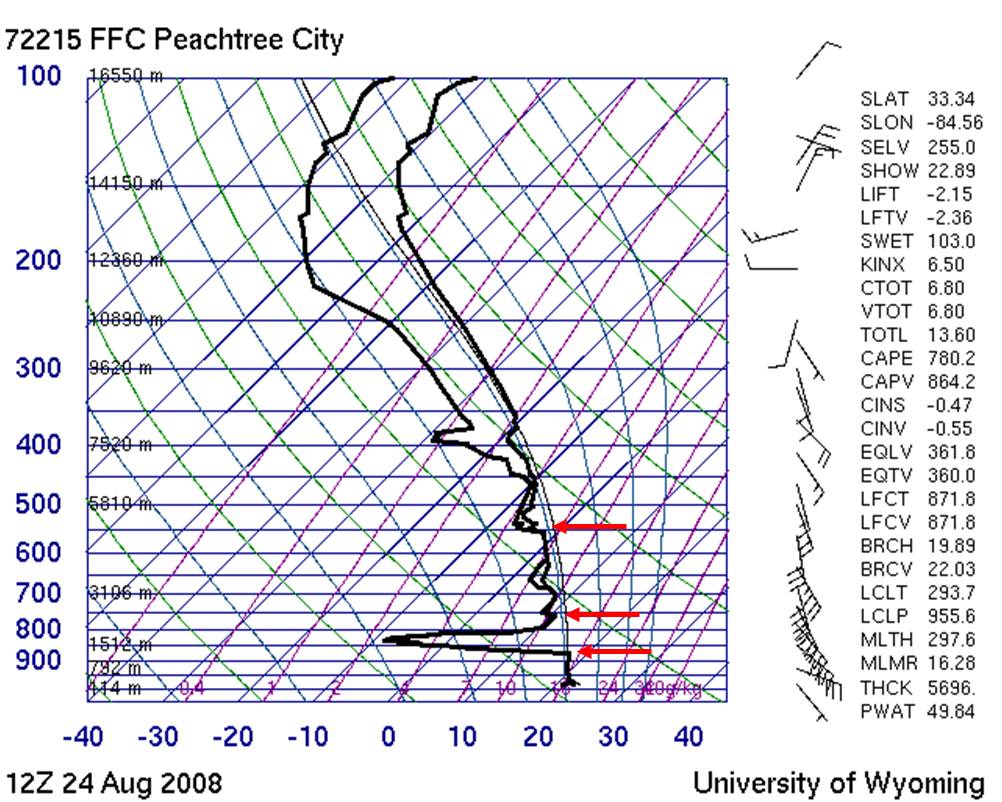
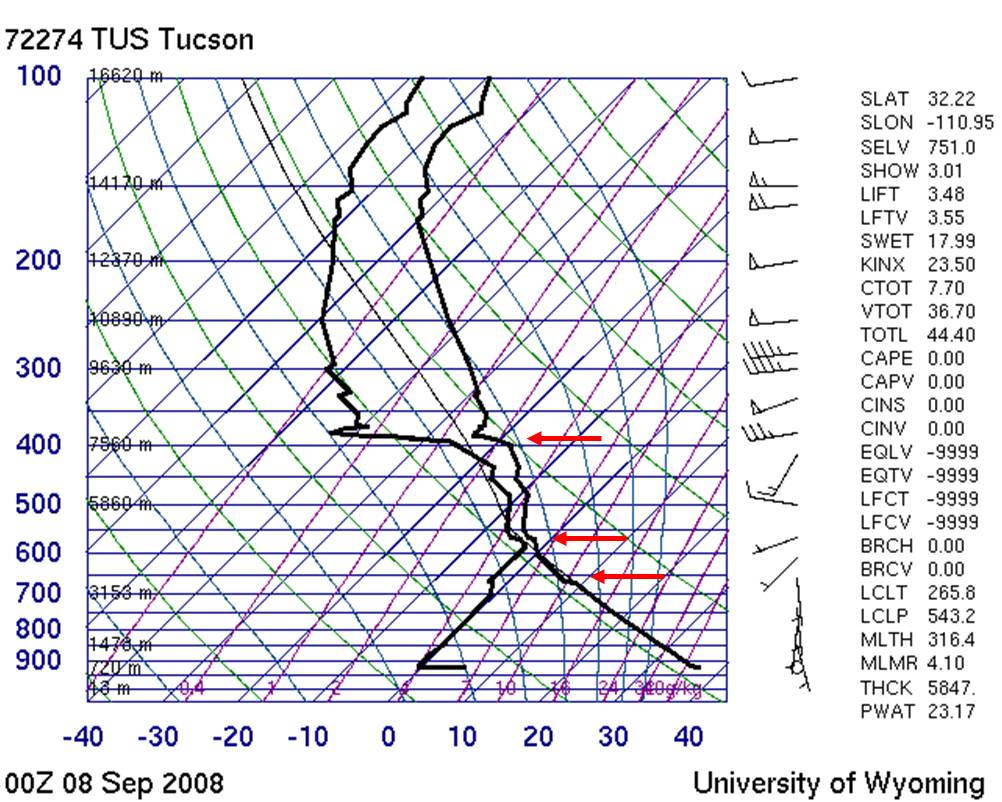
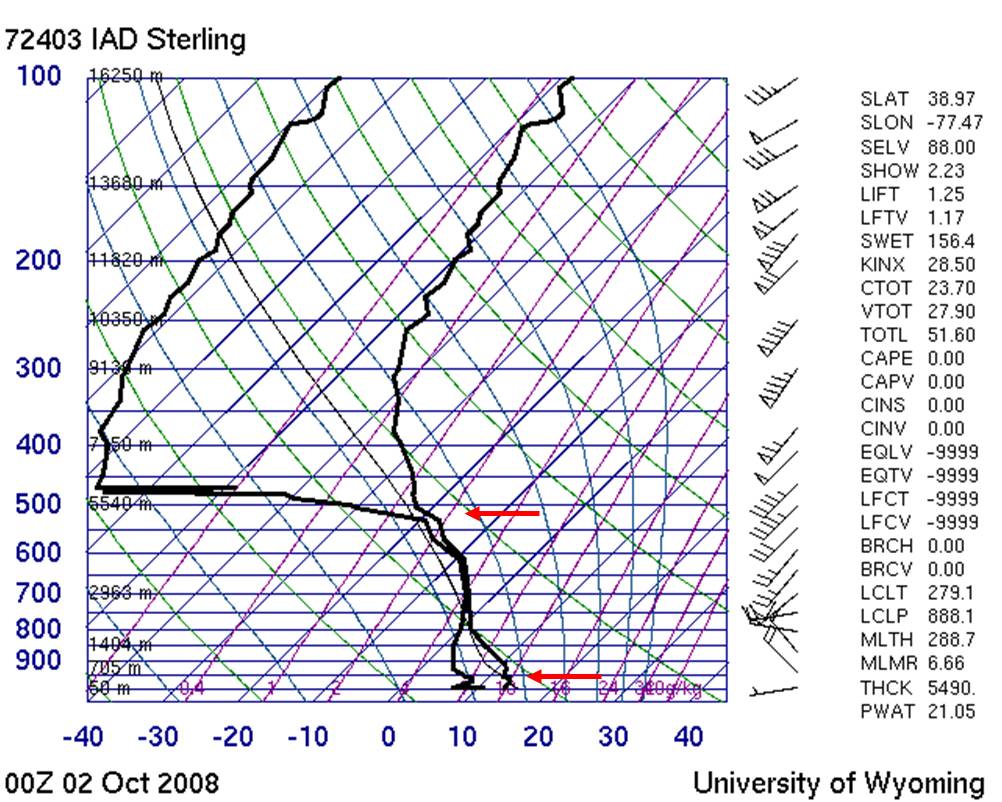
the thermistor. Examples of soundings each having several SSLAs are shown in  Figs. 1 to 3. 

OUR STUDY

Slonaker et al. (1996) investigated the occurrence of superadiabatic lapse rates that were found in soundings from the Forecast Systems Laboratory (FSL) data archives several years ago, well prior to the RRS era that we’re now in. They found that the most dramatic SSLAs were due to the wetbulbing problem after the thermistor was wetted, usually in an environment with precipitation or convective storms. We have been working together to examine quantitatively the occurrence of SSLAs aloft in the archived data from RRS sites and to compare the frequencies with those identified prior to RSS, when other sondes were used by the NWS.

We began this small project in May of 2008 and identified six upper-air sites that had been flying the Lockheed Martin Sippican GPS Mark IIA Microsonde (the sonde chosen for the RRS program) for two years or more. The sites we examined were:

72214  -  Tallahassee, FL
72251  -  Corpus Christi, TX
72265
  -  Midland, TX
72403
  -  Sterling, VA
72572
  -  Salt Lake City, UT
72649
  -  Chanhasen, MN

We processed the archived upper-air data, point-to-point in the WMO text message data, searching for SSLAs (we were not interested in surface-based superadiabatic layers since these occur often and are usually physically realistic for afternoon soundings). We searched for lapse rates of 15C/km or greater. The reason for this criterion is tied to NWS operational procedures for the RRS program (Radiosonde Replacement System (RRS) Workstation User Guide, October 2005 – link to this document is below). The RRS data processing software checks, as the WMO message data are determined, for superadiabatic lapse rates meeting these criteria and when such a super is found, a “Check Message” is produced for the operator - see 9.5.3 of the RRS User’s Guide at:  

www.ua.nws.noaa.gov/Documents/Guide1105.pdf

 The operator is instructed (see section 13.11 of the User Guide) to “…take corrective action…” and to “mark the data” and to “…apply user edits…” for layers exhibiting a wetbulb effect. The user is instructed to “…verify super-adiabatic lapse rates for this condition and mark through the data over a long enough period of time to smooth or interpolate the temperature readings.” It is not obvious that such procedures can yield accurate data. The procedures can make obviously bad data periods “less bad” and also less obvious to those who might work with the soundings.

Physically unrealistic layers that are not corrected by the operator are transmitted and archived as if they were valid data. However, the User Guide notes that sometimes 10 or more check messages may be generated. We feel that most NWS operators don’t perform the suggested, subjective quality control procedures and that RRS has resulted in increased numbers of soundings containing physically unrealistic data. These bad data are going into the long-term upper-air archives. Such problems are not new and research users of the upper-air data have often pointed out the problems with data in the archives (e.g, Pratt 1985; Wade and Barnes, 1988; Bosart, 1990; Elliott and Gaffen, 1991; Schwartz and Doswell, 1991; Wade, 1994).

We examined all soundings in the archives from the identified sites for the period May 1st 2006 through May 31st 2008, a period during which all six sites used the RRS Lockheed Martin Sippican GPS Mark IIA Microsonde instrument. This is a period of slightly more than 2 years, and there are on the order of 1500 individual soundings in the archives at FSL for each station. We then identified one or more prior periods when each site used a different manufacturer’s sonde and examined data taken during those periods for comparison. Information on the new sonde used by the NWS can be found at:

http://www.sippican.com/stuff/contentmgr/files/6f597c276e01b5e1f76a5fed153a0117/sheet/gpsmark2.pdf

The goal of this effort was to quantify one aspect of both the quality of the data from the RRS Sippican sondes that most NWS upper-air stations are now using and the effectiveness of the NWS quality control procedures. We do this by comparing the number of SSLAs for the RRS data period with results of similar analyses for periods when other type sondes were used at the sites examined. The results of these analyses provide quantitative indications of the increased rate at which erroneous data are currently going into the upper-air archives.


FINDINGS

Our findings are shown below. We show the number of occurrences for at least one SSLA meeting the lapse rate criteria and we also show counts for three or more such SSLAs occurring during a single flight. 

72251 – Corpus Christi TX

Two years of RRS Microsonde MKIIA – GPS soundings (5/01/2006 – 5/31/2008)   1528 flights   

At least 1 strongly superadiabatic layer aloft          754 flights  (49.3%)
At least 3 strongly superadiabatic layers aloft
         154 flights   (10.1%)

Two years of  VIZ B2 MicroART soundings  (5/01/2001 – 5/31/2003)                       1546 flights

 At least 1 strongly superadiabatic layer aloft            73 flights   (4.7%)
At least 3 strongly superadiabatic layers aloft
             5 flights  (0.3%)

Two years of VIZ B MicroART soundings  (05/01/1995 – 05/31/1997)                      1530 flights

 At least 1 strongly superadiabatic layer aloft            221 flights (14.4%)
At least 3 strongly superadiabatic layers aloft
             21 flights  (1.4%)


The results for
Corpus Christi data are quite astounding and extremely disturbing, showing an increase of more than 10 times as many SSLAs than the prior period when the VIZ B2 instrument was used at that station.. There were about 30 times more flights with three or more SSLAs detected after the switch to the RRS system. It is interesting that the earlier switch to VIZ B2 sondes had led to a significant improvement over the performance of the VIZ B sonde.

The data from Corpus Christi show the worst degradation of data quality (at least for the superadiabatic criteria we examined) of the six stations. We assume that, since the SSLAs we are identifying are mostly due to wetbulbing on the thermistor, the results reflect the frequent presence at Corpus Christi of heavy clouds and saturated environments during flights. Note that we have not attempted to evaluate the impacts of each year’s weather on the data from the stations examined. We realize that there are some impacts upon the data depending upon how wet or dry a given year was at a specific location, but we have taken a broad approach here and not tried to assess local weather conditions.

72214 – Tallahassee FL

Two years of RRS Microsonde MKIIA – GPS soundings (5/01/2006 – 5/31/2008)       1555 flights

At least 1 strongly superadiabatic layer aloft          700 flights (45.0%)
At least 3 strongly superadiabatic layers aloft
        166  flights (10.7%)

Two years of  Vaisala RS80 MicroART soundings  (5/01/2003 – 5/31/2005)               1558 flights

At least 1 strongly superadiabatic layer aloft          114 flights (7.3%)
At least 3 strongly superadiabatic layers aloft
           17 flights (1.1%)


The degradation of the data quality, as indicated by the increase in the number of SSLAs, has been serious at
Tallahassee but not to the degree as that at Corpus Christi. The occurrence of SSLAs increased by more than five times after the change to the RRS and the occurrences of three or more SSLAs increased by about 10 times. Results for the other sites we examined follow:


72265 – Midland TX

Two years of RRS Microsonde MKIIA – GPS soundings (5/01/2006 – 5/31/2008)    1554 flights  

At least 1 strongly superadiabatic layer aloft             401 flights (25.8%)
At least 3 strongly superadiabatic layers aloft
             63 flights  (4.1%)

Two years of  Vaisala RS80 MicroART soundings  (5/01/2003 – 5/31/2005)               1561 flights

At least 1 strongly superadiabatic layer aloft               58 flights (3.7%) 
At least 3 strongly superadiabatic layers aloft
               8  flights  (0.5%)


72572 – Salt Lake City UT

Two years of RRS Microsonde MKIIA – GPS soundings (5/01/2006 – 5/31/2008)       1523 flights

At least 1 strongly superadiabatic layer aloft          394 flights (25.9%)
At least 3 strongly superadiabatic layers aloft
          29 flights  (1.9%)

Two years of  Vaisala RS80 MicroART soundings  (5/01/2003 – 5/31/2005)                1459 flights

At least 1 strongly superadiabatic layer aloft           220 flights (15.1%)
At least 3 strongly superadiabatic layers aloft
          105 flights  ( 7.2%)

Two years of  SDD MicroART soundings     (5/01/1992 – 5/31/1994)                       1545 flights

At least 1 strongly superadiabatic layer aloft         284 flights (18.7%)
At least 3 strongly superadiabatic layers aloft
            9 flights  ( 0.6%)


The
Salt Lake City data seem similar to the results from the other stations, except that the Vaisala RS80 MicroART sonde performed nearly as poorly as the new RRS sonde. The reasons for this are unknown.


72403 – Sterling VA

Two years of RRS Microsonde MKIIA – GPS soundings (5/01/2006 – 5/31/2008)       1580 flights

At least 1 strongly superadiabatic layer aloft          383 flights (24.2%)
At least 3 strongly superadiabatic layers aloft
           68 flights  (4.3%)

Two years of  Vaisala RS80 MicroART soundings  (5/01/2003 – 5/31/2005)                1548 flights

At least 1 strongly superadiabatic layer aloft             54 flights ( 3.5%)
At least 3 strongly superadiabatic layers aloft
            25  flights  (1.6%)

Two years of  VIZ B MicroART soundings    (5/01/1993 – 5/31/1995)                          1511 flights

At least 1 strongly superadiabatic layer aloft              188 flights (12.4%)
At least 3 strongly superadiabatic layers aloft
              14 flights  (0.9%)


72649 – Chanhassen MN

Two years of RRS Microsonde MKIIA – GPS soundings (5/01/2006 – 5/31/2008)     1534 flights 

At least 1 superadiabatic layer aloft          331 flights (21.6%)
At least 3 superadiabatic layers aloft
           69 flights  (4.5%)

Two years of  Vaisala RS80 MicroART soundings  (5/01/2003 – 5/31/2005)                1505 flights

At least 1 superadiabatic layer aloft            59 flights (3.9%)
At least 3 superadiabatic layers aloft
          11  flights  (0.7%)


The degradation of data quality is similar at all the sites (except Salt Lake City as noted above) and quite significant. The problem with the easily wetted thermistor (note that there are a number of other significant problems with the data from the RRS sondes – (see Overview of Problems with Data from the RRS Sippican Sondes  at   www.madweather.com ) is seriously compromising the quality of the long term upper-air data base.  

There are several aspects of the RRS and the new sonde that probably result in more SSLAs and other problems. The RRS software uses smoothed 1 sec data to determine significant levels. In contrast, the MicroART software worked with 6-sec smoothed data. The Sippican microsonde is smaller than previous sondes, and thus its sensors are probably smaller with faster response times. The thermistor also apparently does not have a water repellant coating.


SUMMARY AND WARNING

There are large numbers of soundings with physically unrealistic data being added to the upper-air archives each month. The NWS quality control procedures are obviously not working. Anyone using these data for research, computations, or statistical analyses needs to understand that there are new and significant problems with the reliability of the data owing to the NWS transition to the Microsonde MKII – GPS sondes.


REFERENCES

Bosart, L. F., 1980: degradation of the North American radiosonde network. Wea. Forecasting, 5,527-528. 

Elliott, W. P., and D. J. Gaffen, 1991: The utility of radiosonde humidity archives for climate studies. Bull. Amer. Meteor. Soc., 72, 1507-1520. 

Pratt, R. W., 1985: Review of radiosonde temperature and humidity problems. J. Atmos. Oceanic Technol., 2, 404-407. 

Schwartz, B. E., and C. A. Doswell III, 1991: North American rawinsonde observations: Problems, concerns, and a call to action. Bull. Amer. Meteor. Soc., 72, 1885-1896. 

Slonaker, R. L., B. E Schwartz, and W. J. Emery, 1996: Occurrence of nonsurface superadiabatic lapse rates within RAOB data. Wea. Forecasting, 3, 350-359. 

Wade, C. G., and S. L. Barnes, 1988: Geopotential height errors in NWS rawinsonde data at Denver. Bull. Amer. Meteor. Soc., 69, 1455-1459. 

Wade, C. G., 1994: An evaluation of problems affecting the measurement of low relative humidity on the United States radiosonde. J. Atmos. Oceanic Technol., 11, 687-700. 

Figures 1, 2 and 3 are shown below
(from the
Univ. of Wyoming upper air page - http://weather.uwyo.edu/upperair/)
 Red arrows indicate the SSLAs that are present in these three examples.

FFC Peachtree City Sounding 12z 24 Aug 2008

FIGURE 1

TUS Tucson Sounding 00z 08 Sep 2008

FIGURE 2

IAD Sterling Sounding 00z 02 Oct 2008

FIGURE 3


HOME

Photo Gallery

The
Monsoon
Observations & Forecasting MCS's in
Arizona
Gulf
Surges
Other
Topics
Useful
Links
Contact
Me